Palestine to Africa: How maps lie — and some tell the truth
Google Earth came into existence in 2005. A year later, it experienced a revolutionary tremor.
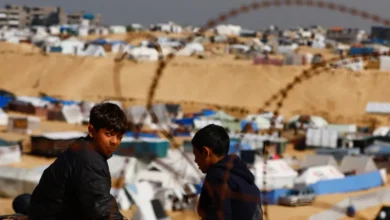
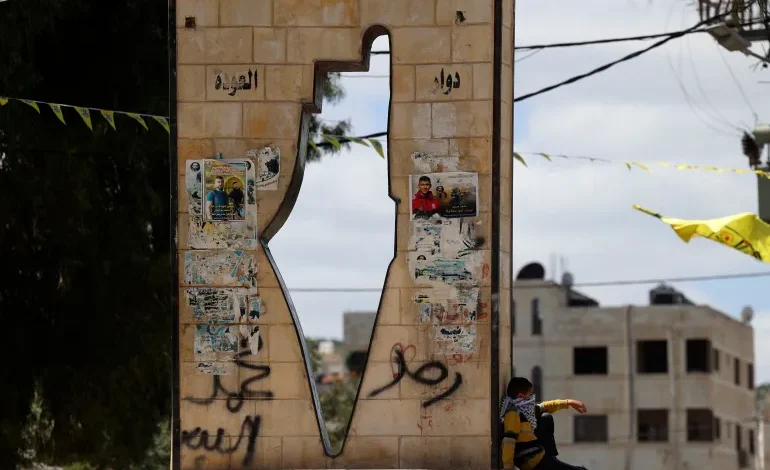
A Palestinian man from Jenin, Thameen Darby, created the Nakba Layer, mapping Palestinian villages that were destroyed or depopulated in the 1948 Arab-Israeli war. The maps showed parts of Palestine that are not even seen in maps created by Palestinian authorities, geographer Linda Quiquivix, who researched the Nakba map and maps of Palestine, told Al Jazeera.
The Nakba map of 2006 sparked controversy and anger among some Israelis, who reported it to their local police for being an “assault on true geography”.
But what is true geography? Do the maps we see every day accurately represent borders and spaces?
Do maps lie?
“Not only is it easy to lie with maps, it is essential,” wrote cartographer Mark Monmoneir in his book How to Lie with Maps.
He showed that condensing complex, three-dimensional spaces onto a two-dimensional sheet of paper is bound to be reductive. Maps are made by people, historically those with power. Hence, they are a projection of how people see the world – projections that are full of preconceived ideas and biases.
However, maps are also deliberately skewed to distort people’s perceptions of spaces and issues, he argued. “A good propagandist knows how to shape opinion by manipulating maps,” wrote Monmoneir.
Propaganda maps were popular during and even before the 20th century when warring nations used cartography to further their war-time agenda, painting the opposing nations as negative caricatures.Different symbols were used on maps: for example, the octopus with its multiple tentacles was used to depict the aggressor. While a British cartographer used the octopus to depict Russia, a French cartographer depicted Winston Churchill as the mollusc. Propaganda maps were also popular during the Cold War.
The West’s map hegemony
A common template used for world maps today is called the Mercator projection, created by European cartographer Geert de Kremer in 1569. The projection has been criticised for being widely misleading as it significantly distorts proportions. While three Canadas can fit inside Africa, Africa is significantly smaller and less detailed than Canada on the map. Fourteen Greenlands can squeeze into Africa — but on the Mercator map, the Danish territory is shown almost as large as Africa.
Alaska looks larger than Mexico, when in reality it is smaller. Europe — not including Russia — seems to be about the same size as South America. In reality, South America is nearly twice as large. And Europe is at the centre of the map, with the Asia-Pacific to the periphery, when Asia is the globe’s most populous continent, the planet’s largest land mass, and today, the world’s economic nerve centre.
In the 1800s, the Gall-Peters Projection was introduced, subverting the Eurocentric proportions of the Mercator Projection and sizing landmasses more accurately. However, it was not until the 1970s that the Gall-Peters projection was introduced to a wider audience. And most educational institutions around the world still use the Mercator Projection to teach geography in classrooms.
Map wars
It is not just the Mercator Projection though.
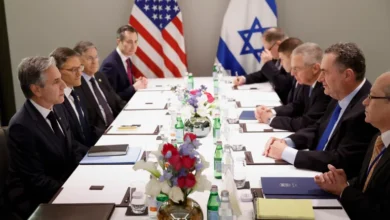
In May 2019, then-US President Donald Trump signed “nice” on a map of Israel indicating that the occupied Golan Heights belong to Israel, rather than Syrian territory. The Golan Heights were occupied by Israel during the 1967 Six-Day War and then effectively annexed in 1981, a move that has not been recognised by the international community.In November of the same year, the Russian parliament’s lower house announced that Apple Maps would display Crimea as part of Russia when viewed from Russia. Crimea was annexed by Russia from Ukraine in March 2014, a step that was criticised internationally. Initially, Apple suggested showing Crimea as an undefined territory, but it ended up complying with Russia, earning condemnation from Ukrainians. Mashable reported in 2022 that Apple started clearly marking Crimea as part of Ukraine, at least outside of Russia.
Additionally, China uses maritime maps to claim all of the South China Sea. Using a U-shaped line called the nine-dash line, China’s maps declare that the South China Sea — a key maritime trade thoroughfare — belongs entirely to China. This has been a bone of contention between China and Southeast Asian neighbours, including Malaysia, the Philippines and Vietnam, which also claim the waters nearest to their coasts.
An international tribunal ruled in 2016 that the map does not provide China with legal grounds to claim the sea, but this did not stop the nine-dash line from appearing on a newly released Chinese national map in 2023.
India and Pakistan both control parts of Kashmir. After New Delhi revoked the semi-autonomous status of Indian-controlled Kashmir, withdrawing its statehood and carving it into two federally governed territories in 2019, Islamabad hit back — with a map. In 2020, Islamabad unveiled a map that showed all of Kashmir — including the part controlled by India — as belonging to Pakistan.
Israel’s current war on Gaza has not been immune to concerns about the use of maps either.
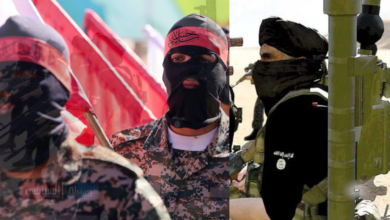
Semafor media reported that after the escalation of violence between Israel and Hamas on October 7, Planet Labs, which used to provide crucial satellite imagery, began to restrict and obscure images of Gaza.
What do maps like the Nakba map do?
Counter-maps challenge dominant mapping that has historically influenced how the world sees the world.
They are also called bottom-up maps or resistance maps. The Nakba map is an example. Quiquivix learned about the Nakba map during her attempts to trace the way that Palestinians have been using maps.
She started to also see that after the Oslo Accords in 1993, a lot of the Palestinian leadership’s energies went into making maps that were parallel to a state of Israel, leaning towards a “two-state” view of the land. The leadership mapped only the Gaza Strip and the West Bank, and not all of Palestine “where the refugees [believe they] still have the right of return, and where there’s also Palestinian citizens of Israel”, she explained. Israel has denied Palestinians who were evicted from their land in 1948, and their descendants, the right to return.
This, she said, has led to cartographic erasure of Palestinians. On the other hand, Darby’s Nakba map has villages that Palestinian refugees in exile can use to “show the world where their villages are that were destroyed or occupied to create the State of Israel”.
The advent of the internet has equipped locals and communities with platforms to share their own maps, said Quiquivix.
“It’s just so much harder for the dominant world to hide its contradictions.”