Turkey earthquake fault lines mapped from space
It seems almost insensitive to start to have a deep dive into the science behind Monday’s earthquake events in Turkey.
More than 22,000 people are already confirmed dead and an unknown number still lie trapped, with the window for their rescue closing rapidly.
And yet the science will go on. The insights gleaned from this event will save lives in the future.
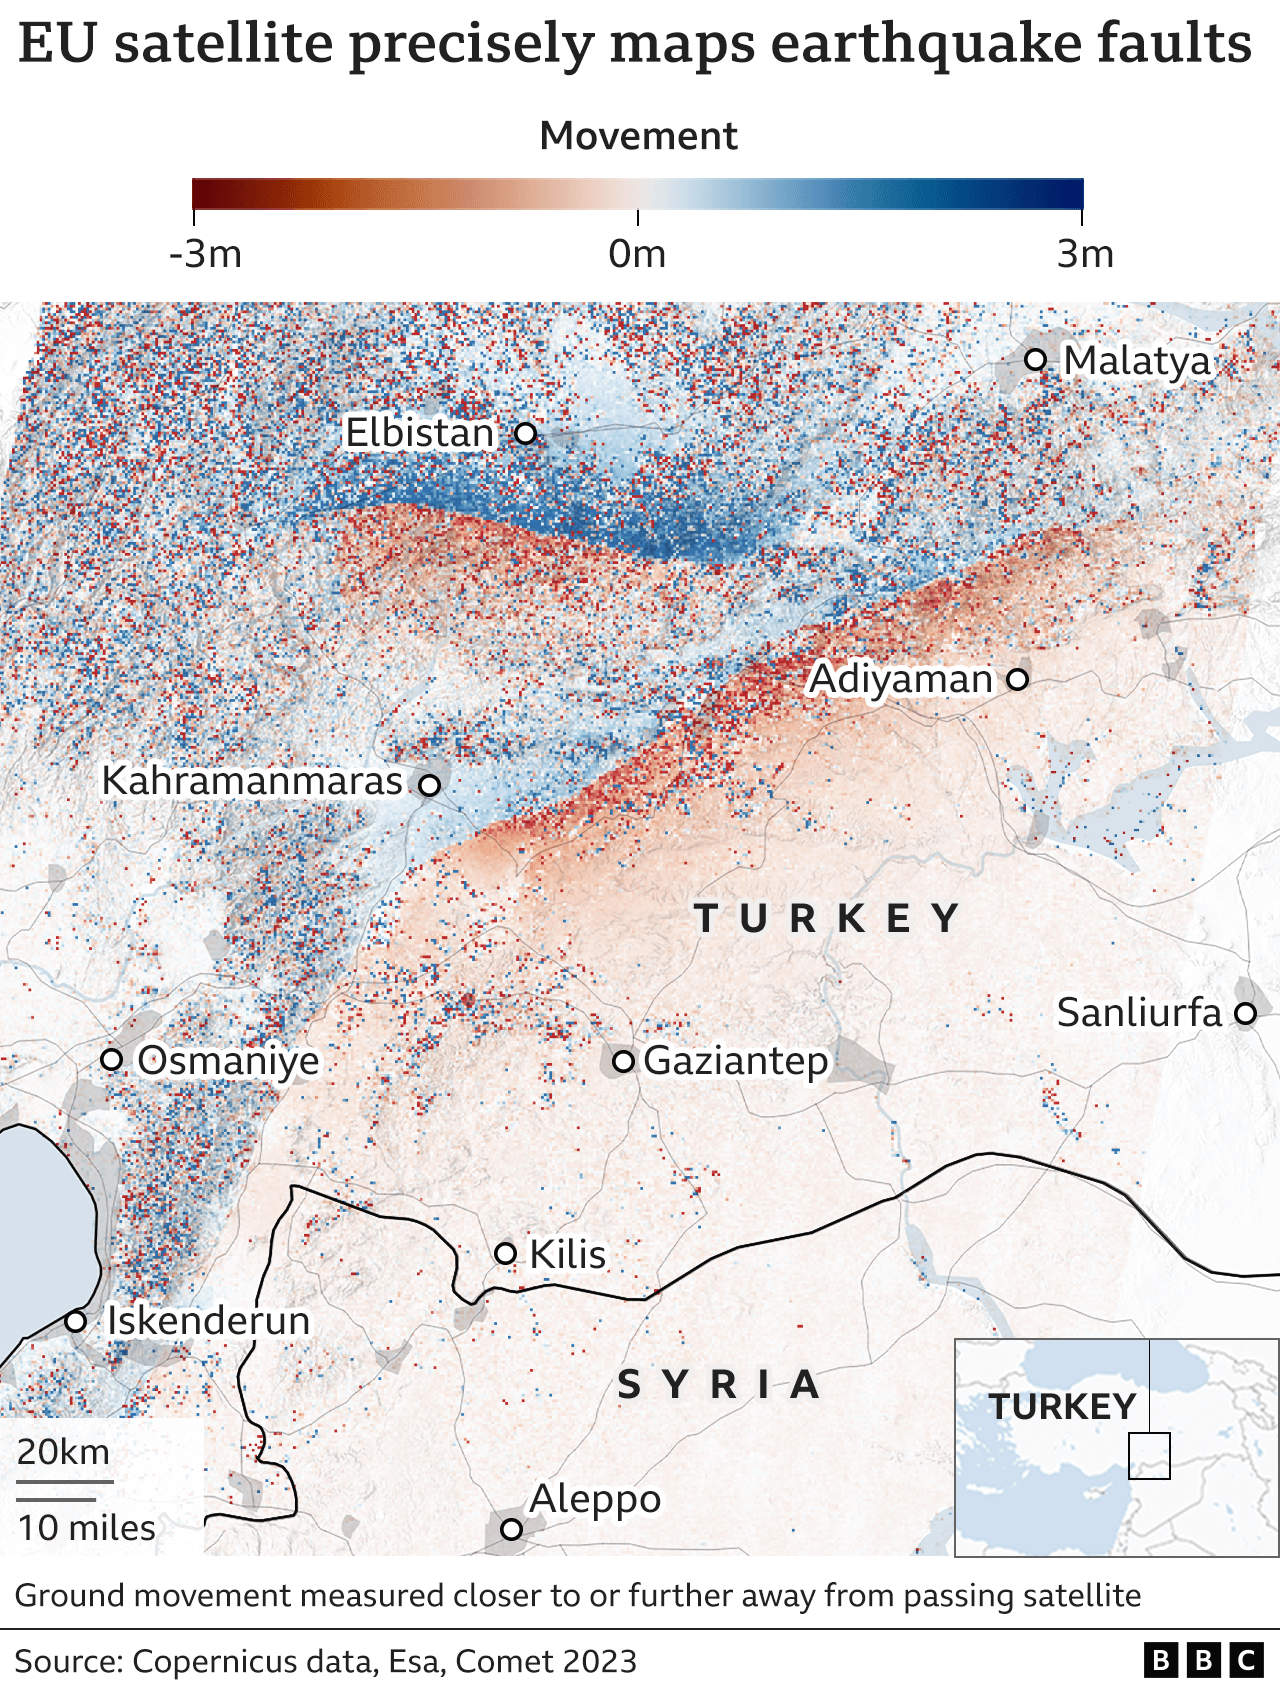
Take a look at the map on this page. It is the most precise yet produced of how the ground lurched in response to the enormous energies that were unleashed.
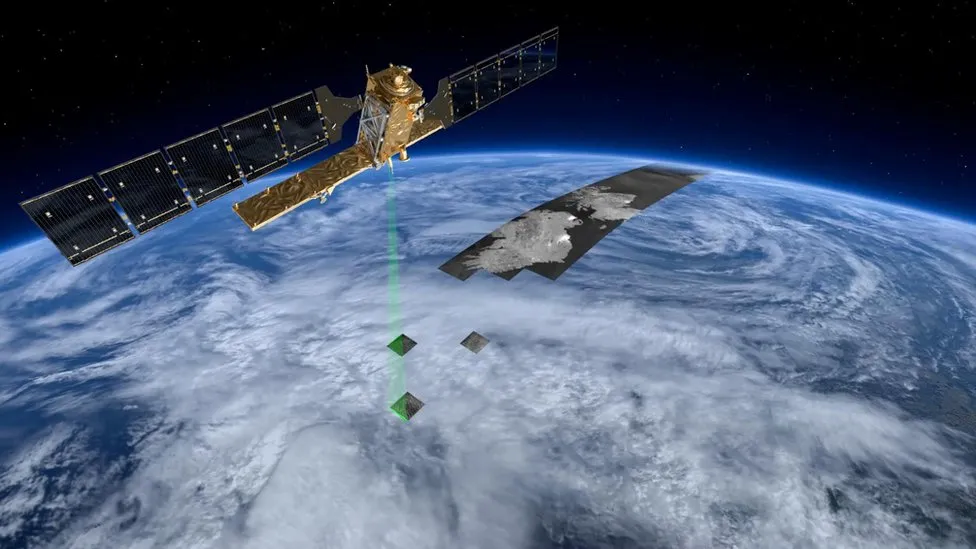
The data behind it was acquired in the early hours of Friday by the European Union’s Sentinel-1A satellite as it traversed north to south over Turkey at an altitude of 700km (435 miles).
The Sentinel carries a radar instrument that is able to sense the ground in all weathers, day and night.
It is routinely scanning this earthquake-prone region of the world, tracing the often very subtle changes in elevation at the Earth’s surface.
Except, of course, the changes on Monday were not subtle at all; they were dramatic. The ground bent, buckled and in places ripped apart.
Researchers use the technique of interferometry to compare “before” and “after” views. But you do not really need to be an expert to see the consequences for Turkey in the latest Sentinel map.
The red colours here describe movement towards the satellite since it last flew over the country; the blue colours record the movement away from the spacecraft.
It is abundantly clear how the ground has been deformed along and near the East Anatolian Fault line.
For both the Magnitude 7.8 quake that struck first on Monday at 01:17 GMT and the Magnitude 7.5 event at 10:24, the motion is “left-lateral”. That is to say: whichever side of the fault you are on, the other side has moved to the left. And by several metres in places.
The shocking thing is that the lines of rupture have gone right through settlements; in lots of places they will have gone right through buildings.
The Sentinel map will help scientists understand exactly what happened on Monday, and this knowledge will feed into their models for how earthquakes work in the region, and then ultimately into the risk assessments that the Turkish authorities will use as they plan the recovery.
There is sure to be a lot of discussion about how the two major tremors were related and what that could mean for further instability.
The map was processed by the UK Centre for Observation and Modelling of Earthquakes, Volcanoes and Tectonics (Comet). Its director, Prof Tim Wright, said the Sentinel observations vividly brought home the scale of the forces involved.
“News outlets always show earthquakes as ‘the epicentre’, as if it is a single point source (like a bomb). Actually, all earthquakes are caused by slip on extended faults, and the bigger the quake the bigger the fault that ruptured,” he told BBC News.
“We can map those ruptures with satellites because the ground around them is displaced, in this case by up to 5m or 6m. The rupture of the first event was 300km or so long and the second big event ruptured another 140km or so of a different fault. To put those distances in context, London to Paris is roughly 345km.
“Damage will be highest near the fault but of course spreads over a wide region either side of the fault, too. It’s absolutely horrific.”

In the era before satellites, geologists would map earthquake faults by walking the lines of rupture. It was a laborious process that naturally also missed a lot of detail. Radar interferometry from space was developed in the 1990s, and in recent years it has become a particularly compelling tool.
In part that is down to the quality of the sensors now in orbit, but it is also the result of more powerful computers and smarter algorithms.
It is possible today to get a data product on to the computers of experts, ready for analysis, within hours of a satellite making an overhead pass. Comet, unfortunately, had to wait several days for Sentinel-1A to be in the right part of the sky to get an optimal view of Turkey. But this will improve as more and more radar satellites are launched.
“By the end of the decade, we should be able to do this kind of analysis within a day of most damaging earthquakes, and then we would be more useful for the relief effort. As things stand, we are of course outside the 72-hour window for search and rescue,” Prof Wright said.